For each catalog, you can view detailed reports showing viewing statistics for presentations grouped in it. You can export all data to an Excel or XML file.
Click Edit > Analytics > Run and select a date range for the report. In the report, you will find the results summary, viewership details, and user and IP address summary reports.
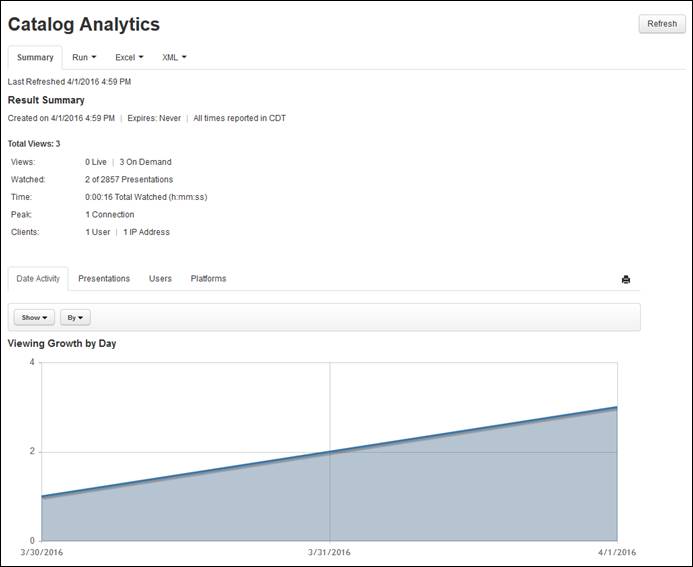
Sample catalog analytics
Results summary
The results summary includes the following information:
•Total views: The total number of times the presentations specified in the report was watched (includes live and on-demand views).
•Views (x live views, y on-demand views): The number of times the presentations specified in the report was watched live and on-demand.
•Watched (x of y): The number of presentations watched out of the total number of presentations included in the report.
•Time: The total amount of time (h:mm:ss) users spent watching the selected presentations.
•Peak: The highest number of concurrent views for the presentation.
•Clients (x User, y IP Address): The number of unique users who have viewed the presentations. The number of unique IP addresses used to view the presentations.
Viewership details
Click the following links in the catalog's analytics report to view the viewership details:
•Date Activity: Click to view graphical data and a grid showing the viewing growth, total number of views, and peak connections for presentations specified in the report. You can view the data by day or month. Mouse-over a point in the graph to see details for a specific data point. For example, when displaying the date activity graph with the Show Views and By Day options selected, you will see the number of views on a particular day.
•Presentations: In this view, you can see data for each presentation in the catalog. The data can be sorted by attribute (presentation, total views, etc.) as well as ascending and descending order. The data can be displayed as a bar graph or as a list. Drill down support is available for each item. For example, clicking on a presentation will display its summary report.
•Users: In this view, you can see which users viewed the presentation, the number of views they had and what percentage of the presentation they viewed. You can sort the information displayed by user, total views, coverage, etc. Click the link for the user to view the user summary report with date activity, viewing trends and platform views. Click the graphical data to view a quick summary report.
•Platforms: Click to see graphical data showing the total views for each browser, platform, system, player and media plugin supported in Mediasite. You can change the information displayed and the graphical style, using the Show and Style drop-down lists, respectively.